Welcome!
This is the community forum for my apps Pythonista and Editorial.
For individual support questions, you can also send an email. If you have a very short question or just want to say hello — I'm @olemoritz on Twitter.
problem with 3d plot
-
hello again
I have another problem: in a simple scatter plot, the points are not plotted correctly in 3d. I useax.scatter(x, y, z, s=80, color=c, marker='o', alpha=1.0, linewidth=0)I am working on Luv color space, and i try to visualize where the colors go. In the following graph, the brighter points should be above the darker ones, not behind.
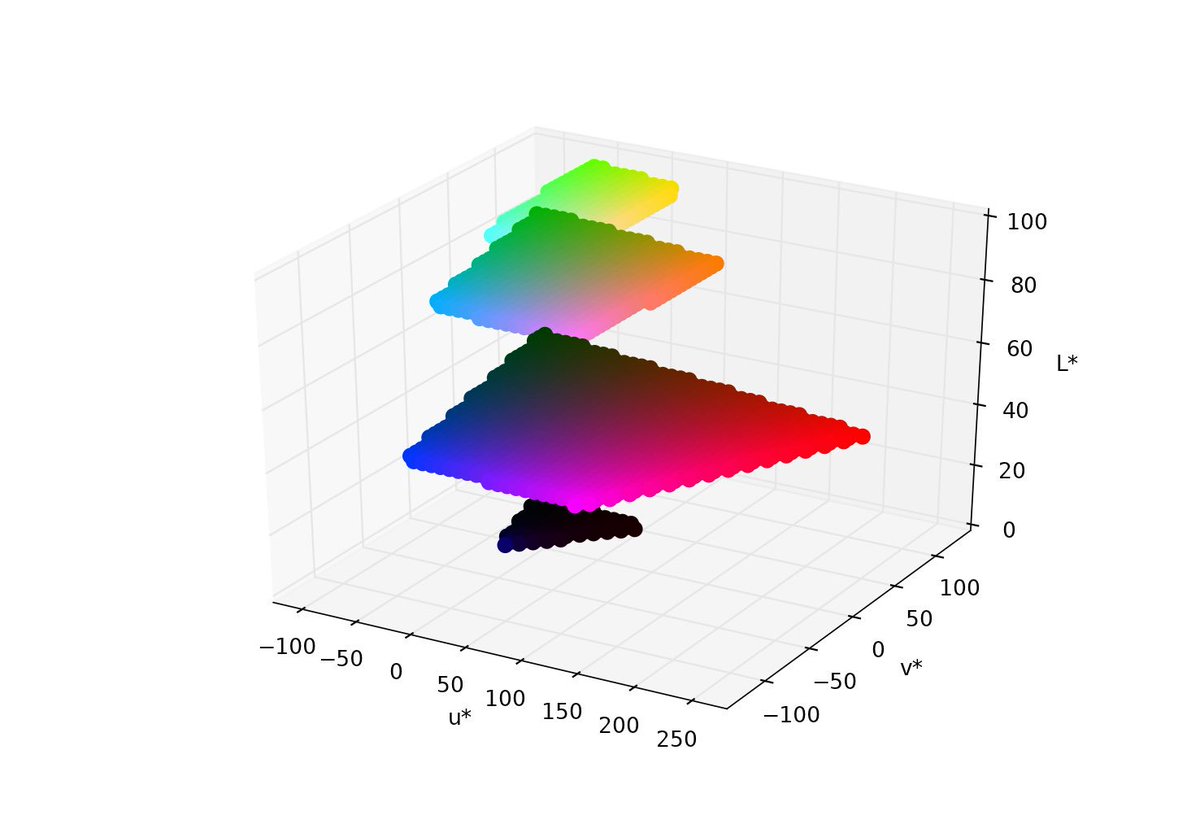
I have tried to plot the top group before or after or simultaneously but i always get the same image. Oh, and the top group is really above others...
Note that the bottom black group is correctly plotted behind the pink one. So there doesnt seem to be any systematic rule for the plotting order?
Any idea?
Thanks. -
this is really weird: when i add more points this what i get now
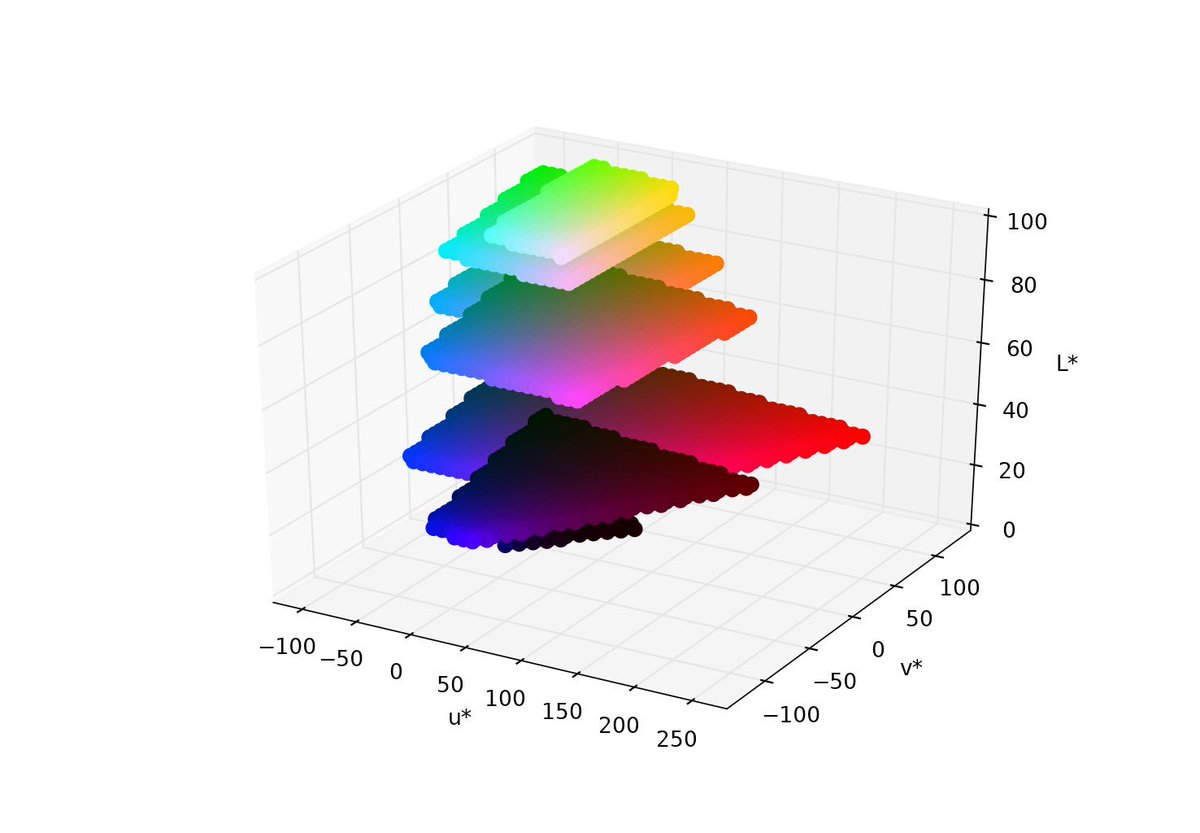
the order has changed but it seem random.
The points are all stacked in 1d arrays x,y,z,c, starting from low L values to high L values. -
by the way, can you see the images i have put in the post above? Not sure whether the links are permanent...
-
@jmv38 we see them
-
@jmv38 Hi in my opinion you should post here the full example that reproduces what you obtain with info about Pythonista version you use, in this way people that read your post can test your code quickly bye
-
@Matteo mmm when i try to select my whole code (only 300 lines) to copy it then Pythonista get frozen and i cant do anything but kill pythonista => is it a known bug?
-
here is the code
def rgb_to_XYZ(r, g, b): ref = 0.17697 r /= 255.0 g /= 255.0 b /= 255.0 x = (r*0.49 + g*0.31 + b*0.2 ) / ref y = (r*ref + g*0.8124 + b*0.01063) / ref z = (r*0.0 + g*0.01 + b*0.99 ) / ref return x,y,z def XYZ_to_rgb(X, Y, Z): r = X * 0.41847 - Y * 0.15866 - Z * 0.082835 g = -X * 0.091169 + Y * 0.25243 + Z * 0.015708 b = X * 0.00092090 - Y * 0.0025498 + Z * 0.17860 r = int(r*255+0.5) g = int(g*255+0.5) b = int(b*255+0.5) return r,g,b # un utilitaire pour vérifier si le rgb est bien valide (pas tjrs le cas!) def inside(mini,x,maxi): return (mini<=x) and (x<=maxi) def valid_rgb(r,g,b): return inside(0,r,255) and inside(0,g,255) and inside(0,b,255) d = 6.0/29.0 d3 = d*d*d d2 = d*d y0 = 4.0/29.0 # un blanc de reference est necessaire pour les calculs CIE r = 5.650675255693056/100 # necessaire pour convertir l'illuminant Y=100 dans le meme range que XYZ D65 = (95.047*r,100.0*r,108.883*r) Xn,Yn,Zn = D65 def _forward(t): if t > d3: y = pow(t,1.0/3.0) else: y = t/3.0/d2 + y0 return y def _inverse(t): if t > d: y = t*t*t else: y = 3*d2*(t-y0) return y # le systeme L*,u*,v* que j'appelle 'sLuv' comme 'star Luv' # dans ce systeme, la distance euclidienne entre couleurs est a peu pres conforme à la JND de l'oeil Un = 4*Xn/(Xn+15*Yn+3*Zn) Vn = 9*Yn/(Xn+15*Yn+3*Zn) def XYZ_to_sLuv(X, Y, Z): L = 116*_forward(Y/Yn) - 16 s = (X+15*Y+3*Z) if s==0 : return 0.,0.,0. Up = 4*X/s Vp = 9*Y/s u = 13*L*(Up-Un) v = 13*L*(Vp-Vn) L,u,v = round(L,3),round(u,3),round(v,3) return L,u,v def rgb_to_sLuv(r,g,b): X,Y,Z = rgb_to_XYZ(r,g,b) return XYZ_to_sLuv(X, Y, Z) def sLuv_to_XYZ(L,u,v): if L==0 : return 0.,0.,0. Y = Yn * _inverse((L+16)/116) Up = u/13/L + Un Vp = v/13/L + Vn x = 9*Up/(6*Up-16*Vp+12) y = 4*Vp/(6*Up-16*Vp+12) X = x*Y/y Z = (1-x-y)*Y/y return X,Y,Z def sLuv_to_rgb(L,u,v): X,Y,Z = sLuv_to_XYZ(L,u,v) return XYZ_to_rgb(X, Y, Z) def get_sLuv_limits(): Lmin,Umin,Vmin = rgb_to_sLuv(0,0,0) Lmax,Umax,Vmax = Lmin,Umin,Vmin for r in [0,255]: for g in [0,255]: for b in [0,255]: L,u,v = rgb_to_sLuv(r,g,b) Lmin,Umin,Vmin = min(Lmin,L),min(Umin,u),min(Vmin,v) Lmax,Umax,Vmax = max(Lmax,L),max(Umax,u),max(Vmax,v) return Lmin,Umin,Vmin,Lmax,Umax,Vmax def get_limits(toLuv): Lmin,Umin,Vmin = toLuv(0,0,0) Lmax,Umax,Vmax = Lmin,Umin,Vmin for r in [0,255]: for g in [0,255]: for b in [0,255]: L,u,v = rgb_to_sLuv(r,g,b) Lmin,Umin,Vmin = min(Lmin,L),min(Umin,u),min(Vmin,v) Lmax,Umax,Vmax = max(Lmax,L),max(Umax,u),max(Vmax,v) return Lmin,Umin,Vmin,Lmax,Umax,Vmax from numpy import linspace def getPoints(zz,toLuv,toRGB,x,y,z,c): Lmin,Umin,Vmin,Lmax,Umax,Vmax = get_limits(toLuv) L = Lmin + zz*(Lmax-Lmin) for vv in linspace(0.0,1.0,num=50): v = Vmax - (Vmax-Vmin)*vv for uu in linspace(0.0,1.0,num=50): u = Umin + (Umax-Umin)*uu #print(u,v) r,g,b = toRGB(L,u,v) if valid_rgb(r,g,b): x.append(u) y.append(v) z.append(L) c.append((r/255,g/255,b/255)) #print(u,v,L,) return True def show3d(toLuv,toRGB): Lmin,Umin,Vmin,Lmax,Umax,Vmax = get_limits(toLuv) Lmin,Umin,Vmin,Lmax,Umax,Vmax = round(Lmin),round(Umin),round(Vmin),round(Lmax),round(Umax),round(Vmax) from mpl_toolkits.mplot3d import Axes3D import matplotlib.pyplot as plt fig = plt.figure() ax = fig.add_subplot(111, projection='3d') ax.set_xlabel('u*') ax.set_xlim([Umin,Umax]) ax.set_ylabel('v*') ax.set_ylim([Vmin,Vmax]) ax.set_zlabel('L*') ax.set_zlim([Lmin,Lmax]) x,y,z,c = [],[],[],[] for zz in {0.1, 0.3, 0.5, 0.7, 0.8, 0.9, 0.95 }: #x,y,z,c = getSurface(zz,toLuv,toRGB) getPoints(zz,toLuv,toRGB,x,y,z,c) ax.scatter(x, y, z, s=80, color=c, marker='o', alpha=1.0, linewidth=0) plt.show() fig.savefig('test.png') plt.close(fig) if __name__ == '__main__': import console as cs cs.clear() show3d(rgb_to_sLuv,sLuv_to_rgb) -
i use the ‘current’ appstore version of pythonista on ipad air ios 12.0.1 (not yet on 12.1.1)
-
ok guys, i nailed it: i was using a dictionnary for my zz so the order was random.
for zz in {0.1, 0.3, 0.5, 0.7, 0.9, 0.95 }:I changed it to an array
for zz in [0.1, 0.3, 0.5, 0.7, 0.9, 0.95 ]:and now the layers print in the specified order
my bad... :-(
-
the desired result:
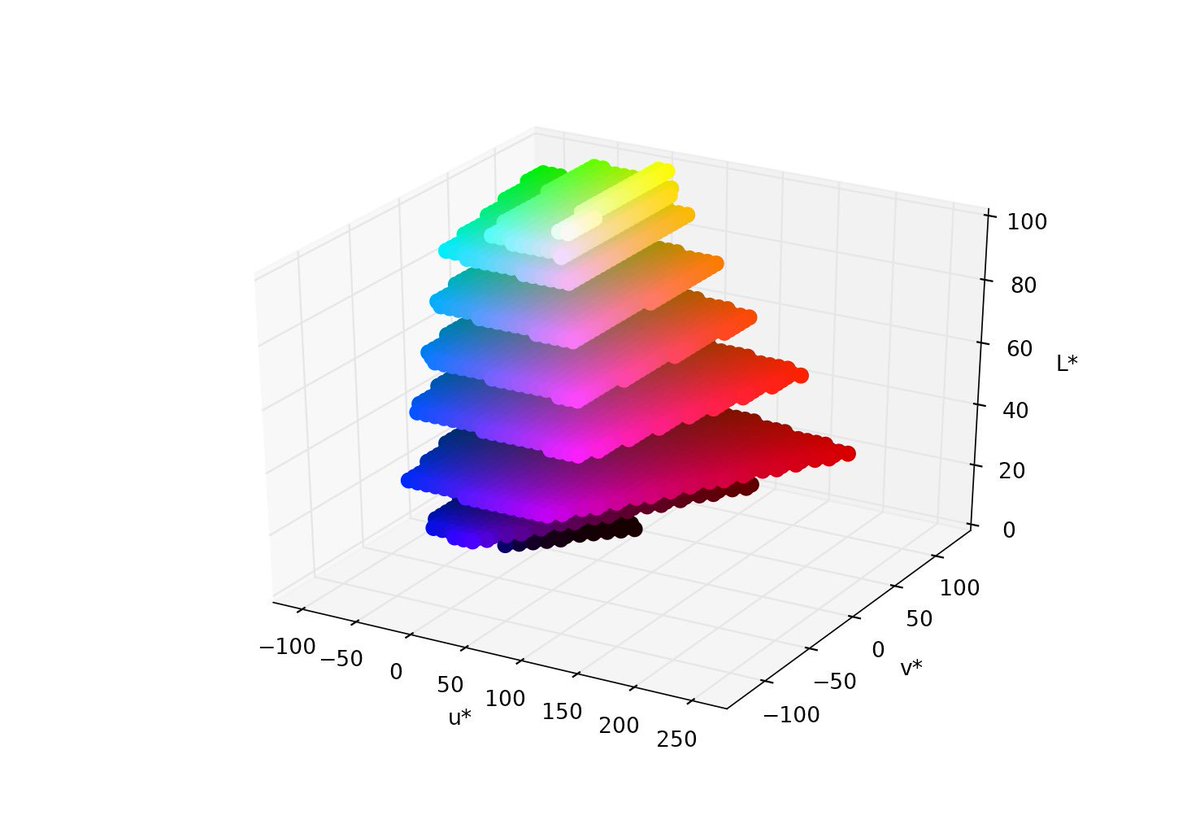
Pretty cool, isn’t it? :-)